The code in this project uses a library called "FHT" which has been included in with these sketch files. This file was originally created by
.
Simply download, extract, and place in your Documents/Arduino/libraries folder.
We want to use a Fast Fourier Transform, or an FFT, to break down audio into a series of frequencies, so we can see how loud the base / mid-range / treble is for a particular audio sample. Keep in mind that the arduino is by no means powerful, and the audio module isn't the greatest quality, so this will result in a much smaller and much noisier signal than what proper digital signal processing uses, but it is more than enough for our purposes.
The FHT library we are using, uses a more real-number friendly FFT conversion algorithm, resulting in a much faster and memory friendly response for our little Arduino.
Here's a bit of a breakdown of the different sections of code:
1 for (int i = 0 ; i < FHT_N ; i++)
2 {
3 while(!(ADCSRA & 0x10))
4 ; // wait for adc to be ready
5
6 ADCSRA = 0xf5; // restart adc
7
8 byte m = ADCL; // fetch adc data
9 byte j = ADCH;
10 int k = (j << 8) | m; // form into an int
11
12 k -= 0x0200; // form into a signed int
13 k <<= 6; // form into a 16b signed int
14
15 fht_input[i] = k; // fill out array
16 }
We take the data out of the analog digital converter for this particular moment in time, as you can see it is a very slim slice of time so we must do this quickly, and sample a short audio segment into the fht_input array. We use raw bit-banging to do this, by controlling the registers manually as they say in the
The library also recommends doing the following, so we'll do them as well:
1 fht_window(); // window the data for better frequency response
2 fht_reorder(); // reorder the data before doing the fht
3 fht_run(); // process the data in the fht
4 fht_mag_log(); // take the output of the fht
Once the fht_run() function runs, the fht_log_out array has the FFT data for our small audio sample, where each of the array indexes refer to a specific frequency in the sample. Here we can just do some simple processing to make the data on the display show nicer, as well as skip the first two frequencies as they are too low to pay any attention to.
1 //skip the first two because they are super low freq.
2 for(int i = 2; i < FHT_N/2; i++){
3 //clear out anything that isn't better than 32
4 if (fht_log_out[i] < 32) {
5 fht_log_out[i] = 0;
6 } else {
7 fht_log_out[i] -= 32; //reduce by 32 just to get a clearer image
8 }
9 fht_log_out[i] *= 2; //double the strength of it
10 /*continue with display*/
11 }
We then grab 4 different frequencies to correspond to how high we display on the LED bar graph, and set the bar graph accordingly.
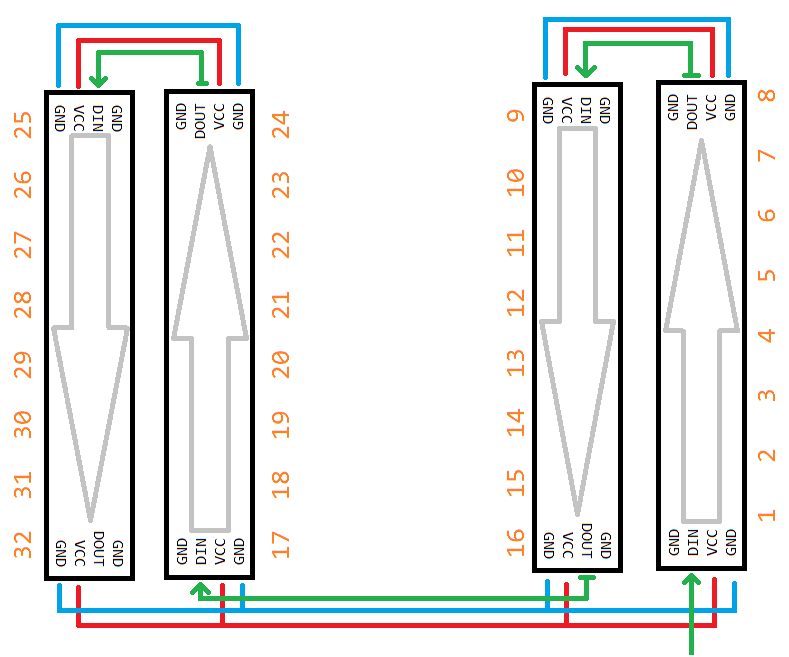
Notice how, because the LED bar graph essentially zig-zags around the front panel, we flip the 2nd and 4th pixel orders, going from (i%8) to 7-(i%8) so that all the columns appear to be oriented the same way.

.png%3Fbranch%3Dprod&w=1080&q=75)
.jpg%3Fbranch%3Dprod&w=1080&q=75)